Features and Usage
Main Features

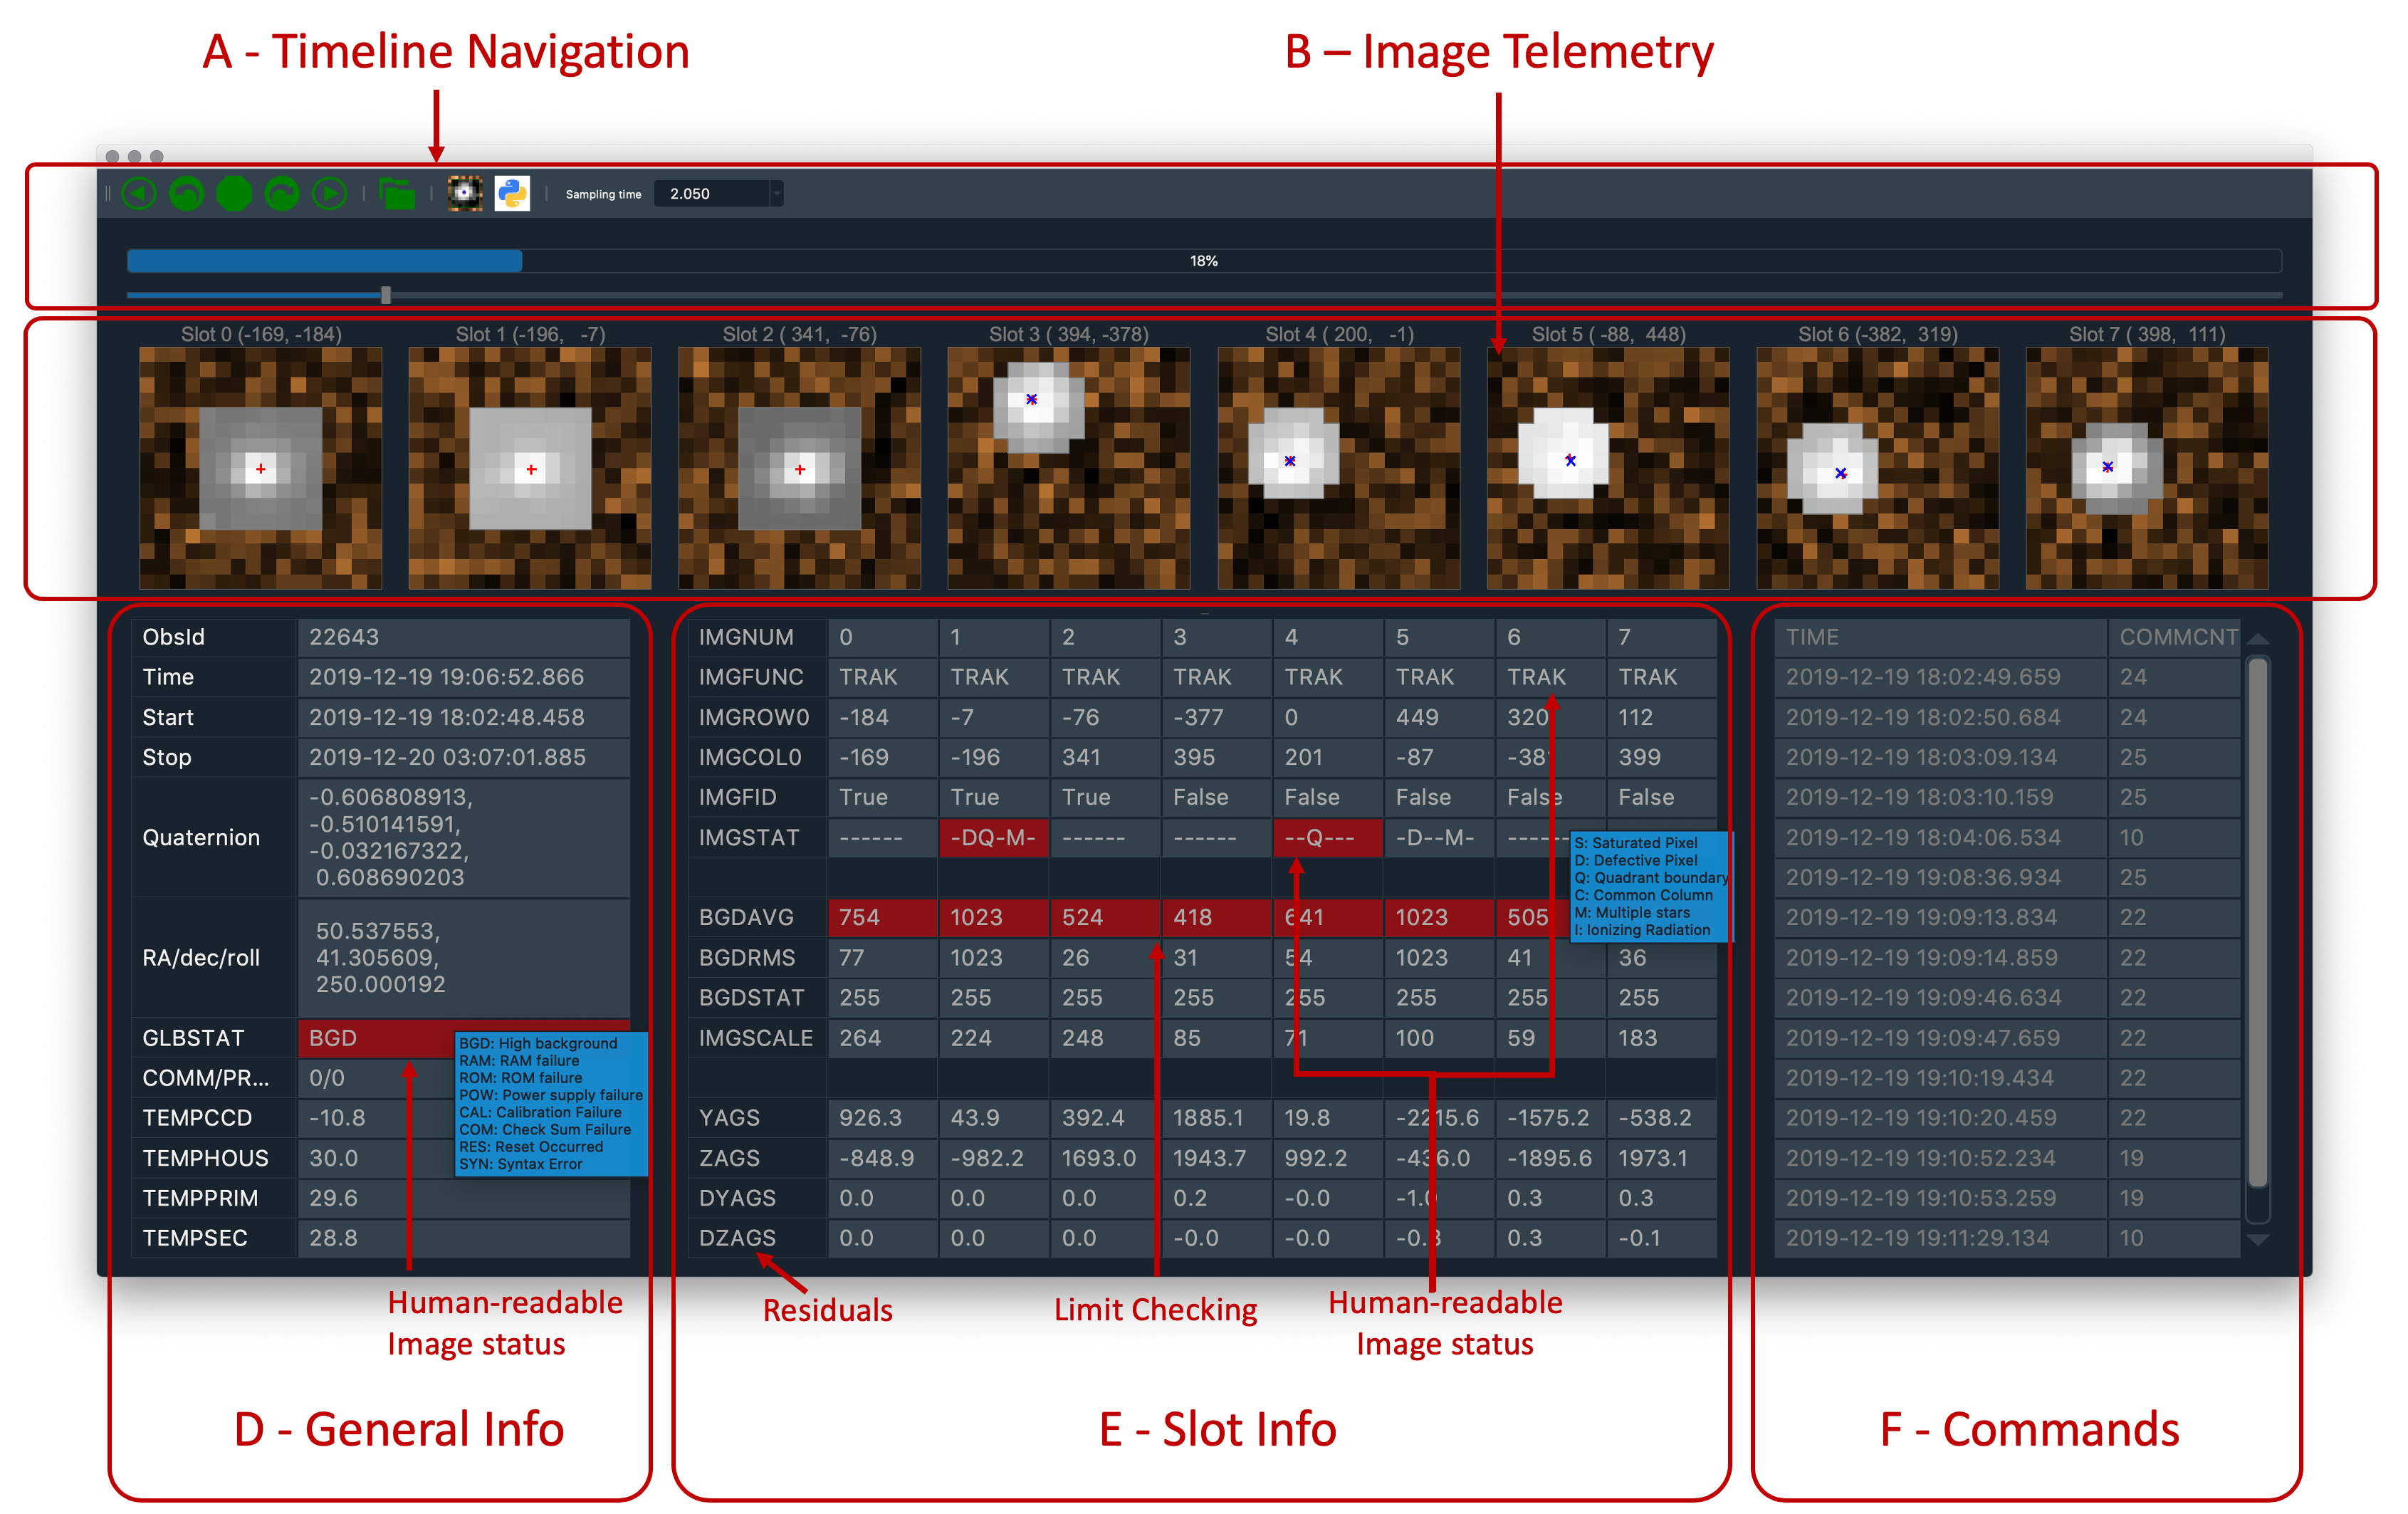
The main elements of the ACA View display are shown in the figure above:
A - Timeline navigation toolbar. Note the different items, from left to right and top to bottom:
Play backward.
Step backward.
Pause.
Step forward.
Play forward.
Load data. When clicked, a dialog opens to choose data to load.
Show telemetry. When clicked, the default view appears.
Show python interpreter. When clicked, and interactive IPython interpreter appears.
Sampling time box. This value determines the size of the time step.
Time slider and progress bar. The slider can be used to move backward/forward along the data timeline. The Progress bar displays the fraction of data already loaded.
B - Image telemetry display. Note the features:
image shape outline corresponds to image type
dark cal is shown around image
centroids are displayed
C - General Info display
Limit checking. Departures from expected levels are marked in yellow/red
GLBSTAT entry is a string code. If you hover the mouse over the corresponding box, you will see a list of all codes.
D - Slot info display
Limit checking. Departures from expected levels are marked in yellow/red
IMGSTAT entry is a string code. If you hover the mouse over the corresponding box, you will see a list of all codes.
E - Event list. Events currently include only commands.
Loading Data
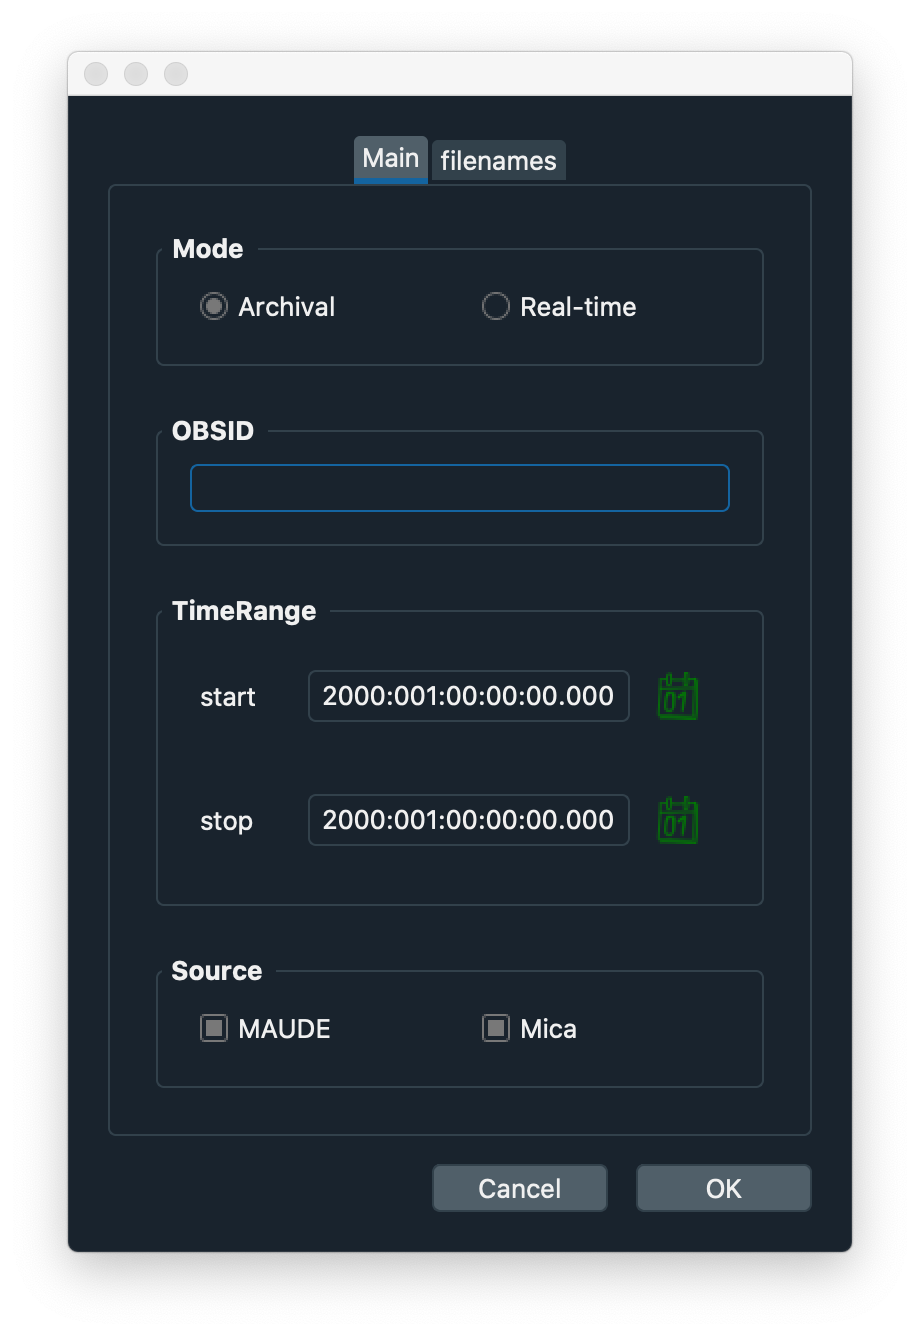
If you click the Load data button, the following dialog will appear. Hopefully it is self explanatory.

IPython Interpreter
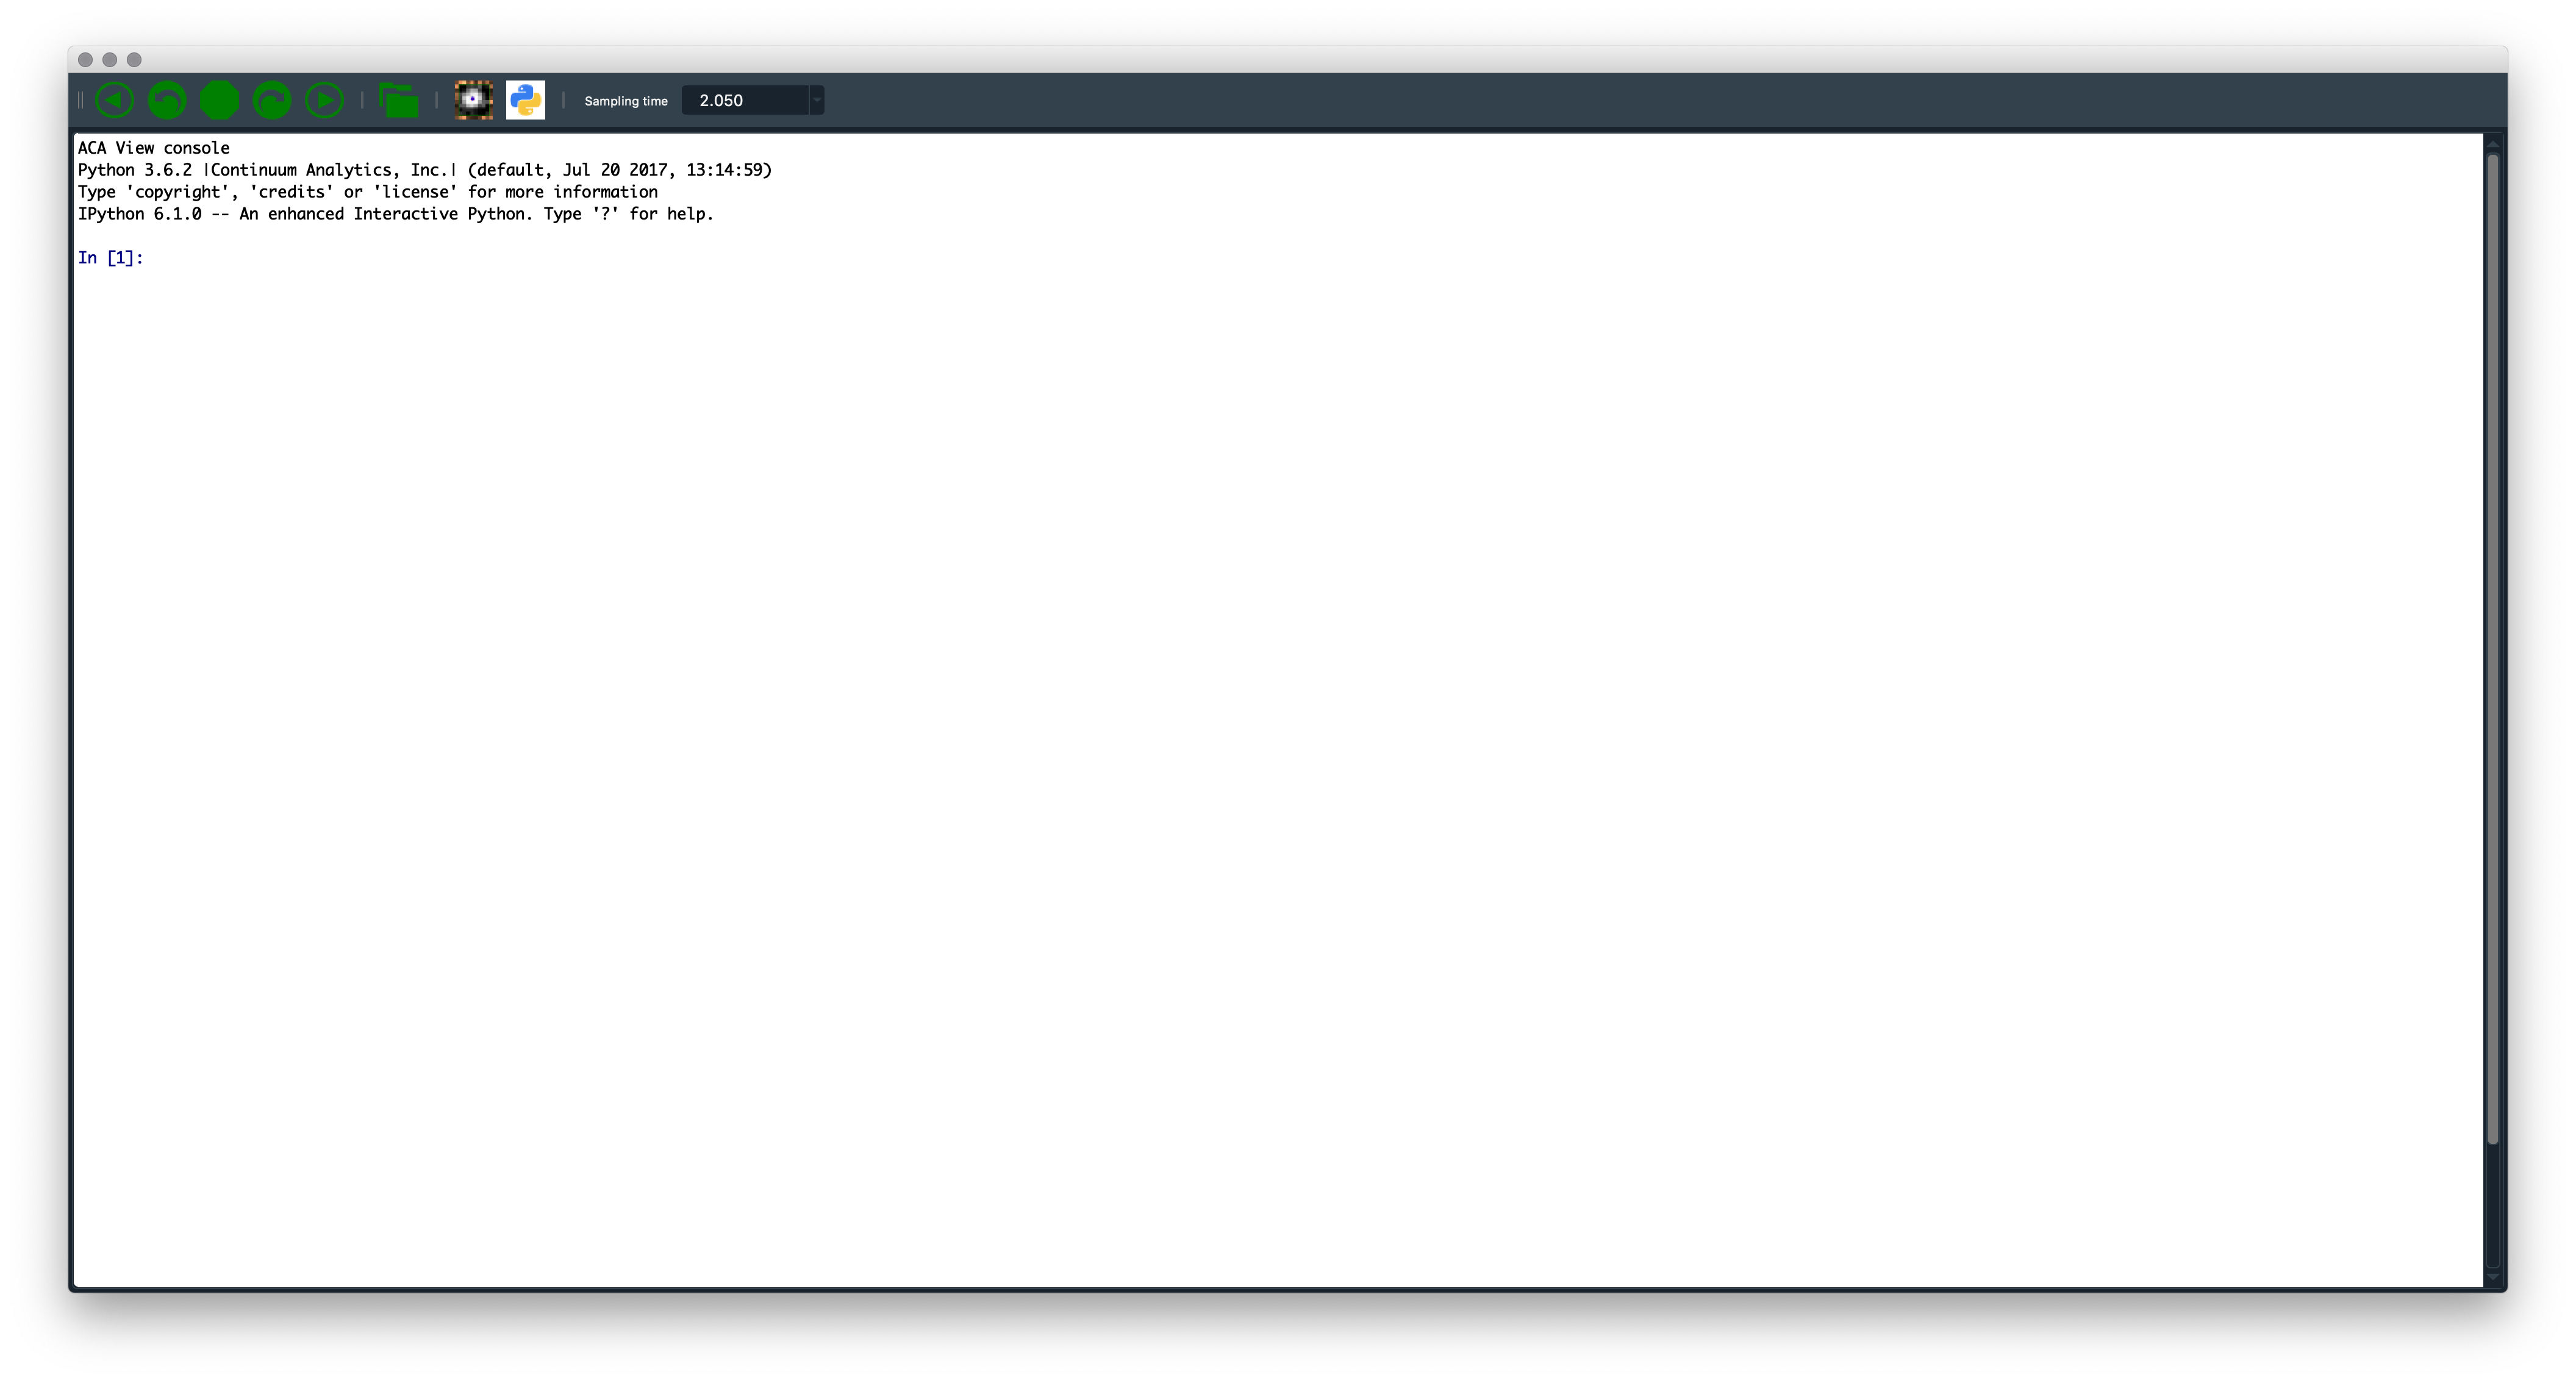
If you click the Python interpreter button, the following will appear.
